Project 01: Data Collection Facts Label
Investigating a Dataset’s Ingredients
Overview
How often have you heard the phrase “data is all around us”? You might think that something so prevalent must be easy to collect– right? Why bother talking about data collection?
Well, as it turns out, not all datasets are created equally.
Through this assignment, you will learn to think critically about how data was collected and how that impacts what it can tell us (and what it cannot).
Think about a Nutrition Facts Label that you see on food items. This label tells us what went into creating a food item: how much fiber, protein, carbohydrates, and so forth. That way the consumer can make an informed decision on if they want to eat this food. In this assignment you will create a Data Collection Facts Label. This label is designed to tell you what went into creating a dataset, such as: who collected the data? When and where did they collect it? Why was it collected? What is included in the data and what is missing?
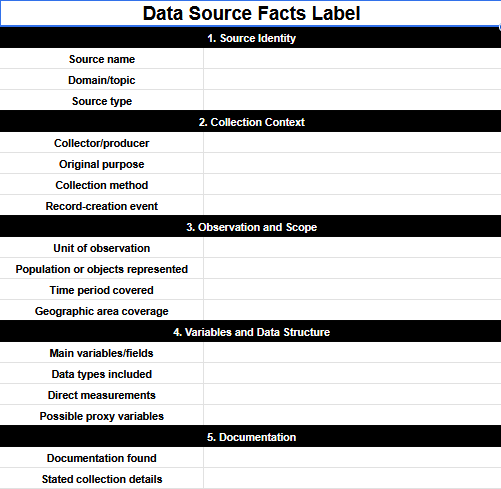
You will complete this assignment in multiple phases/checkpoints, each one described below and linked to more detailed instructions. Your final project deliverable will be a collaborative public website where you present your work, and a pre-recorded presentation. You will only be graded once on the final website and presentation using the evaluation rubric at the bottom of this page.
Phase 1: Pick a domain
Form groups of 2-3 people. Together, select a domain of interest and come up with a data science question related to it.
Choose a topic that interests you and has real-world importance. To ease the process of finding open source data, select a topic you believe to have stakeholders in at least one of the following sectors: research/academia, nonprofit organizations, or government.
Domain Ideas:
- Food habits or nutrition
- Housing affordability
- Public transportation
- Climate change
- Water usage
- Sports injuries
- School funding
- Healthcare access
- Air quality
- Social media behavior
- Campus safety
- Agriculture
- Criminal justice
- Energy use
- Public health
- Disability access
- Environmental pollution
Do not start looking for data sources yet!
Phase 2: Search for Data
This phase of the assignment will be completed independently. Your goal is to find an open source data set related to your research question and create a Data Collection Facts Label for this data set. You and your partner must have different data sets.
Find a Data Source

Comb the internet for a data source that could help answer your research question.
The dataset you use for this assignment must have some form of documentation on the data collection procedure. Some examples of what to look for are: metadata, codebooks, methodology notes, technical reports, and methods sections.
When you find the dataset you will use, let your partner(s) know! The assignment does not work if you select the same datasets: they must be different.
You may choose to modify your research question if you are unable to find a relevant dataset, but your new research question should be in the same domain as before. That way, your research question will remain similar to your partner’s, even if not exactly the same.
Good Places to Look for Data
- American Community Survey
- Bureau of Labor Statistics
- CDC Data Portal
- Census Bureau - Comprehensive data about the US population
- Chico State Library Search
- City or state open data portals such as data.ca.gov
- Data.gov
- Department of Energy Open Data
- Dryad
- EPA Data
- Figshare
- Google Dataset Search
- NASA Open Data / Earthdata
- National Center for Education Statistics
- NCBI - National Center for Biotechnology Information
- NOAA Data
- PLOS One
- RODA - Registry of Open Data on Amazon Web Services including many data sets from scientific, geographic, ecommerce, and other topics
- U.S. Census Bureau Data
- USDA Data
- Zenodo
- Bureau of Labor Statistics
Suggested Search Engine (e.g. Google) prompts
- “[topic] open dataset”
- “[topic] dataset methodology”
- “[topic] data collection method”
- “[topic] research paper data collection”
- “[topic] survey dataset”
- “[topic] government data”
- “[topic] codebook”
- “[topic] methods section”
Use caution with some sources like Kaggle or GitHub. These can be useful, but they may not include enough information about how the data were originally collected. When possible, try to trace the dataset back to its original source and check whether documentation is available..
You may use AI tools as a starting point to help search for data sources, brainstorm keywords, or identify possible datasets and research papers related to your topic. However, do not use or cite AI as a direct source in your work. Treat AI like a search tool: use it to help you find possible sources, then navigate to the original organization that produced the data. Your final sources and citations should come from reliable, traceable original sources, not from AI-generated responses.
Create a Data Collection Facts Label
Do not change the layout of this google sheet. You will be importing this directly into R later. Changing the layout will break your code.
Use the following guide to fill out the blanks in your fact label. The label should contain only the raw facts about the data source, do not try to do an analysis yet. Save judgments about usefulness, ethics, bias, missing information, and comparison for the next phase. You likely will have to do more research and looking around at the data set to find some of this information. You may not find information on all items in the list. If, after a throughough search you can’t find this information simply state that is the case.
| Source name: Title or name of the dataset, data portal, study, report, or data source. | Domain/topic: Topic area the data belongs to, such as food, health, education, housing, climate, transportation, or sports. |
|---|---|
| Source type: Public dataset, government dataset, institutional data, research dataset, data repository, data portal, or student-created dataset. | Collector/producer: Organization (public or private?), researchers, agency, company, community group, or person responsible for producing the data. (This helps us think about how (un)trustworthy the data is). |
| Original purpose: Why the data were originally collected, such as public reporting, research, monitoring, administration, recordkeeping, or planning. (This helps us think about possible ethical concerns and if the data can be appropriately applied to other contexts). | Collection method: How the data were collected or produced, such as survey, interview, sensor, administrative record, mobile app, web scraping, experiment, observation, manual entry, public records, participatory sensing, or transaction records. |
| Record-creation event: What causes one record to be created, such as a survey being submitted, a purchase being made, a sensor reading being taken, a student enrolling, a clinic visit being recorded, a snack being eaten, or an item being discarded. | Unit of observation: What one row, record, case, or entry represents, such as one person, school, product, city, survey response, app entry, hospital visit, weather reading, or snack. |
| Population or objects represented: People, groups, places, objects, events, or behaviors included in the data. | Time period covered: Dates, years, or time range included in the data. |
| Geographic coverage: Location or area covered, such as a city, state, country, school district, hospital system, online platform, or GPS location. | Main variables/fields: Main variables or fields in the data. |
| Data types included: Types of data included, such as numerical, categorical, text, image, date, time, location/GPS, audio, sensor readings, or IDs. | Direct measurements: Variables that measure something directly, such as temperature, age, price, date, location, or a recorded response. |
| Possible proxy variables: Variables that may stand in for something harder to measure. Save the final direct/proxy judgment for the analysis step. | Documentation found: Metadata, codebook, data dictionary, README file, technical report, methods section, survey instrument, or collection notes. |
| Stated collection details: Collection details the source clearly explains. If something is not stated, write “not stated” rather than analyzing it yet. |
Phase 3: Comparative Analysis
This phase of the assignment will be completed together with your group. Your goal is to answer the question: “Which source seems to fit your research question better?”
To answer this question, compare your fact labels side by side. You do not need to repeat all of the basic information from the labels. Instead, focus on noticing the important similarities and differences between the two sources, as well as limitations you may think of that both or neither source encounters.
Your goal is to analyze why the differences matter. This is where you explain what the comparison shows about data collection, representation, limitations, bias, ethics, and your research question.
Questions to consider while doing this comparative analysis are listed below. Do not try to answer every question, but touch on each area.
Trustworthiness/reputability
- What documentation is available for each source?
- What information is missing, unclear, or not stated in each source?
- What limitations or data quality issues might come from how each source was collected?
Degree of relevance to research question
- How do the collection methods affect what kinds of conclusions someone could make?
- In order to answer your research question, would you be employing any of the variables as proxies?
- If you could improve one source, what additional data would you add?
Ethical soundness
- What possible bias might be present in either source?
- What ethical concerns might be connected to either source?
Scope
- What does one row, record, case, or entry represent in each source?
- What populations do each dataset represent? Which is more relevant to your research question? Why?
- What other claims could someone reasonably make using these sources?
Phase 4: Public dissemination
These instructions are still under development
A Quarto Website template repository will be distributed to each team. Each person will have their own page to display their fact sheet, and there will be a combined ‘comparative analysis’ summary page.
The README.md file has instructions on how to build this site and each page has information about what should be on that page.
Follow the best practices discussed in class to collaboratively build this website
- Everyone works on branches
- Only add/commit
.qmdfiles - Submit your work to the
mainbranch using pull requests - Someone other than the author handles the merging
- One person is responsible for building the site.
Build your website
The steps below are a general guideline/order of work to help slowly build up your site with fewest merge conflicts.
Setup (Individual Work)
- Clone the website repo to your account
- Create a branch to work on by typing
git branch -b mybrancnamein the terminal where mybranchname is your name - Communicate with your team and “claim” one of the fact pages (.qmd) and rename this file
- Edit the
_quarto.ymlpage to update the file name for your claimed page - Git add/commit/push only your claimed
.qmdfile and thequarto_ymlfile - Open a PR in github and assign someone to handle the merge.
Test build and push (collab)
Instructions on how to publish a website on Github Pages using the _docs folder https://quarto.org/docs/publishing/github-pages.html#render-to-docs
- One person pull changes to their repo
- Fill out info on the
index.qmdpage about your project. - Do a full page build
- add all files, commit, push
- Check repo publish settings
Template repo should be full setup for you. You just have to make sure the github repo is set to publish from docs on your main branch.
Add your data (individual)
- Make sure you are still on your branch!
- Edit the sharing settings of your data facts google sheet to add your team mates as editors.
- Add the code (excluding the YAML data) from your
data_facts_template.qmdthat you filled out in Phase 2 to your claimed .qmd file. - render to confirm it works
- add/commit/push your single .qmd file.
- Open a PR and assign someone to review & merge
Test build and push (collab)
- One person pull changes to their repo
- Do a full page build to make sure individual facts sheets read from google drive correctly.
- add all files, commit, push
Template repo should be full setup for you. You just have to make sure the github repo is set to publish from docs on your main branch.
Add your comparative analysis (collab)
- Together add your info from phase 3 onto the
analysis.qmdpage. - Merge .qmd to
main - On
mainBuild, git add all, commit, push
Final build and push
- Make sure the
_quarto.ymlandindex.qmdhas all the relevant info - Make sure all pages render and deploy cleanly
- Do one final push with commit message “Project 01 complete”
- Submit your project URL HERE for evaluation
Record your presentation
Plan and record a 5-7 minute long presentation to teach the class about:
- How your datasets were created
- The main findings of your comparison analysis
Each person is responsible for sharing information about their dataset, and will be graded individually on your part of the presentation.
Additionally you will be assigned to review one (1) of your classmates videos and one (1) video from CSCI 608 - the graduate level data science course who are participating in the same activity.
Evaluation Rubric
- Learn different ways of how to interact with github repositories and RStudio in the cloud (not evaluated).
- Find datasets with source documentation (metadata, codebooks, or data dictionaries) to explain who collected each dataset etc. why it was collected, and how it was produced.
- Describe what each dataset represents, including observations, variables, data types, population, place, and time period.
- Evaluate how well the data fit a research question. Identify limitations, missing information, possible bias, data quality issues, and ethical concerns in each dataset.
- Compare datasets to explain how collection methods, purposes, variables, documentation, and context shape what each source can show or miss. Communicate the comparison clearly in a presentation using evidence.
- List a variety of data collection methods used across domains and evaluate their strengths and limitations.
| Category | Weight | 4 - Master | 3 - Adept | 2 - Proficient | 1 - Novice |
|---|---|---|---|---|---|
| Domain, Research Question, and Source Selection | 10% | Student clearly describes a meaningful domain/topic and states a focused research question. The selected data sources are relevant to the question and work well for comparison because they show meaningful similarities and differences. | Student describes a relevant domain/topic and research question. The selected data sources connect to the question and can be compared, though the connection or comparison may need more focus. | Student identifies a general domain/topic, but the research question is broad, unclear, or only loosely connected to the selected sources. The sources may be difficult to compare. | Student does not clearly identify a domain, research question, or usable data sources related to the assignment. |
| Understanding of Source Context and Documentation | 15% | Student clearly explains where the data came from, who produced it, why it was originally collected, how it was collected or produced, and what documentation supports those details. Student distinguishes between what the source states and what is inferred or unclear. | Student explains the main source context and documentation accurately, but some details about purpose, collection method, or documentation may need more precision. | Student gives a basic explanation of the source context, but important information is missing, vague, or not clearly connected to documentation. | Student does not clearly explain where the data came from, who produced it, why it was collected, how it was produced, or what documentation supports the explanation. |
| Data Collection Facts Label | 15% | Student uses the Facts Label effectively to organize important information about each source, including source identity, collection context, observation/scope, variables/data structure, direct/proxy measures, and documentation. Entries are mostly factual rather than analytical. | Student completes the Facts Label with most important information included. Some fields may be brief, vague, or partially incomplete, but the label still helps explain the source. | Student completes parts of the Facts Label, but several important fields are missing, unclear, inaccurate, or mixed with unsupported interpretation. | Student does not complete the Facts Label in a useful way, or the label shows little understanding of what the source is, what records represent, or how the data were produced. |
| Dataset Representation and Measurement | 15% | Student clearly explains what the data represent, including unit of observation, population or objects represented, time/place coverage, major variables, data types, direct measurements, and possible proxy variables. Student shows awareness of how measurement choices shape meaning. | Student explains what the data represent with mostly accurate attention to observations, population/scope, variables, data types, and direct/proxy measures. Some details may need more depth. | Student describes some basic features of the data, but the explanation is incomplete or confused, especially around unit of observation, population/scope, or direct versus proxy measures. | Student does not clearly explain what the data represent, what one record means, what variables are included, or how the data measure the topic. |
| Comparison of Data Sources | 15% | Student makes a clear and meaningful comparison between the sources. The comparison explains how differences in purpose, collection method, population/scope, variables, documentation, and context affect what each source can show or miss. | Student compares the sources across several important features. The comparison is mostly clear, but may need more explanation of why the differences matter. | Student makes a limited comparison. The response may mostly list facts from the labels without fully explaining similarities, differences, or their importance. | Student does not meaningfully compare the sources, or discusses each source separately without explaining how they differ or why the differences matter. |
| Analysis of Fit, Limitations, Bias, Ethics, and Claims | 20% | Student thoughtfully analyzes what the comparison reveals. Student explains how well each source fits the research question, what information is missing or unclear, what limitations or data quality issues may exist, what biases or ethical concerns may be present, and what claims someone could reasonably make or should avoid making. | Student discusses fit, limitations, bias, ethics, and possible claims in a reasonable way, but some points need more evidence, depth, or connection to the data collection process. | Student identifies some limitations, bias, ethical concerns, or fit issues, but the analysis is brief, general, or not clearly tied to how the data were collected or documented. | Student does not meaningfully analyze fit, limitations, missing information, bias, ethics, or appropriate claims, or dismisses these issues without a reasonable explanation. |
| Presentation and Communication | 10% | Presentation is clear, organized, and focused on the assignment purpose. Student introduces the domain and sources efficiently, uses the Facts Labels as evidence, and spends most of the presentation on comparison, analysis, and what someone should know before using the data. | Presentation is understandable and includes the main parts of the assignment, but may need stronger organization, clearer evidence, or more emphasis on comparison and analysis. | Presentation includes some required information, but it may be hard to follow, light on evidence, or focused too much on topic summary instead of data collection and comparison. | Presentation is missing major parts, difficult to follow, or does not focus on data collection, documentation, comparison, or limitations. |