wk11-d01-linear-models
Chico State
DATA 385 - Fall 2026
November 3, 2026
🎥 The language of models (27 min)
🎥 Fitting and interpreting models (30 min). Starts around slide 22
These slides mostly follow the videos, but are not direct code alongs.
New Packages
tidymodels: a collection of modeling packages that follow tidyverse principles. Today we use linear_reg(), fit(), tidy(), and predict().
Can you think of examples of modeling for prediction vs. modeling for explanation?
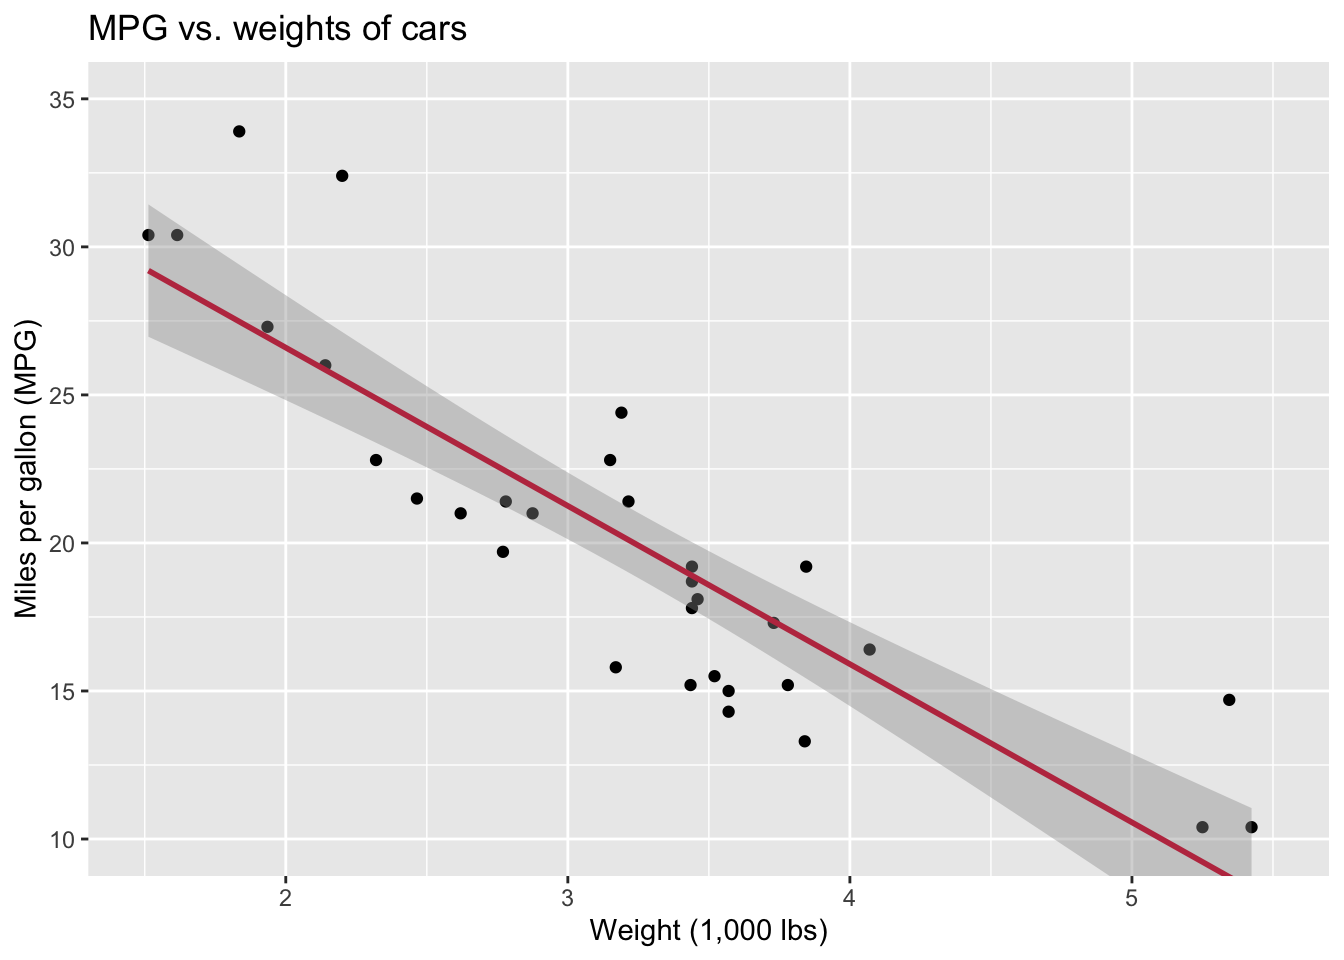
Describe: What is the relationship between cars’ weights and their mileage?
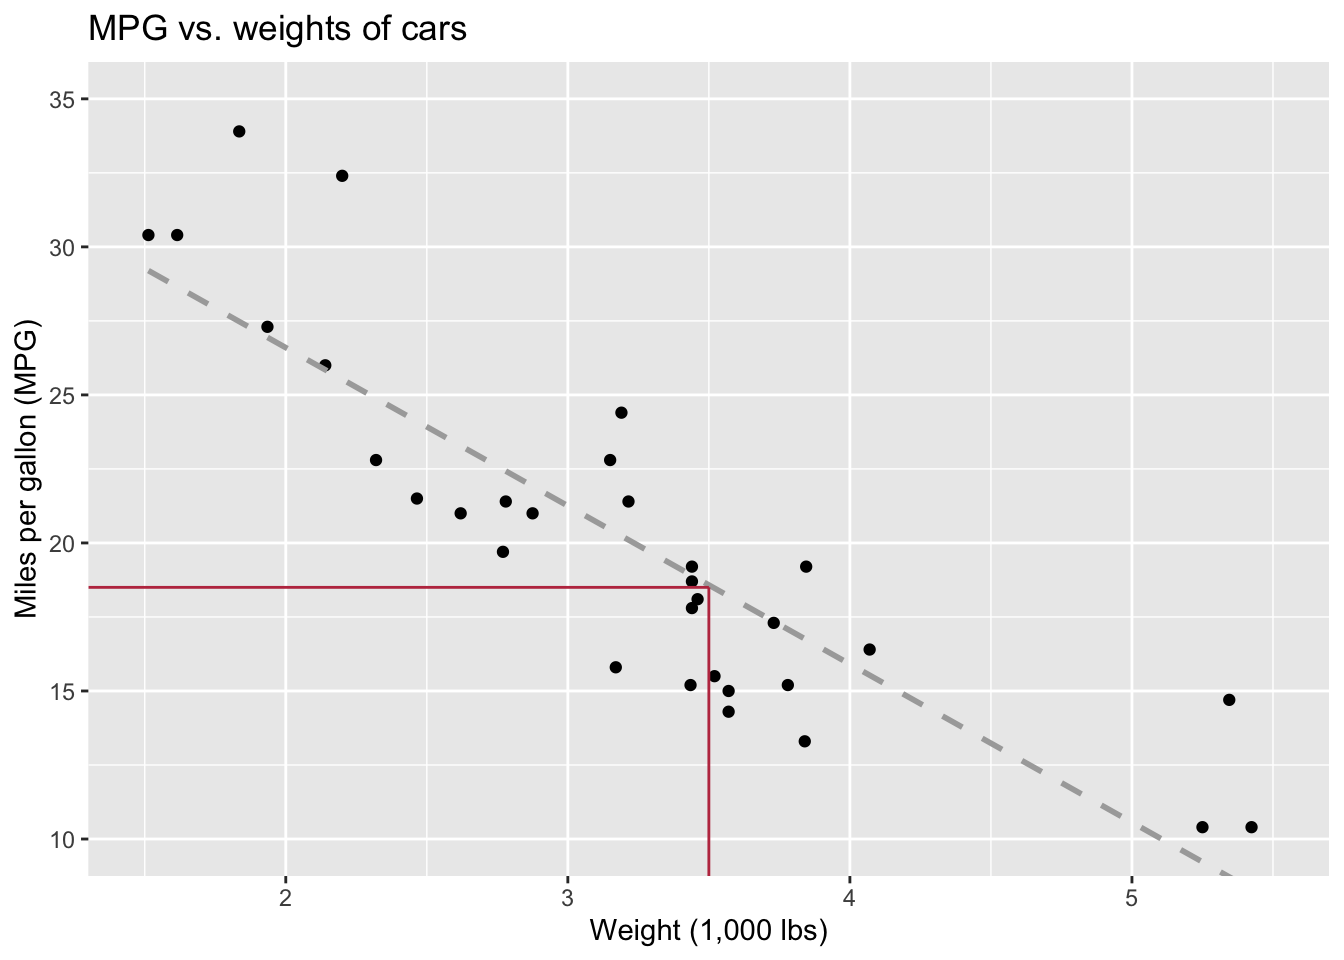
Predict: What is your best guess for a car’s MPG that weighs 3,500 pounds?
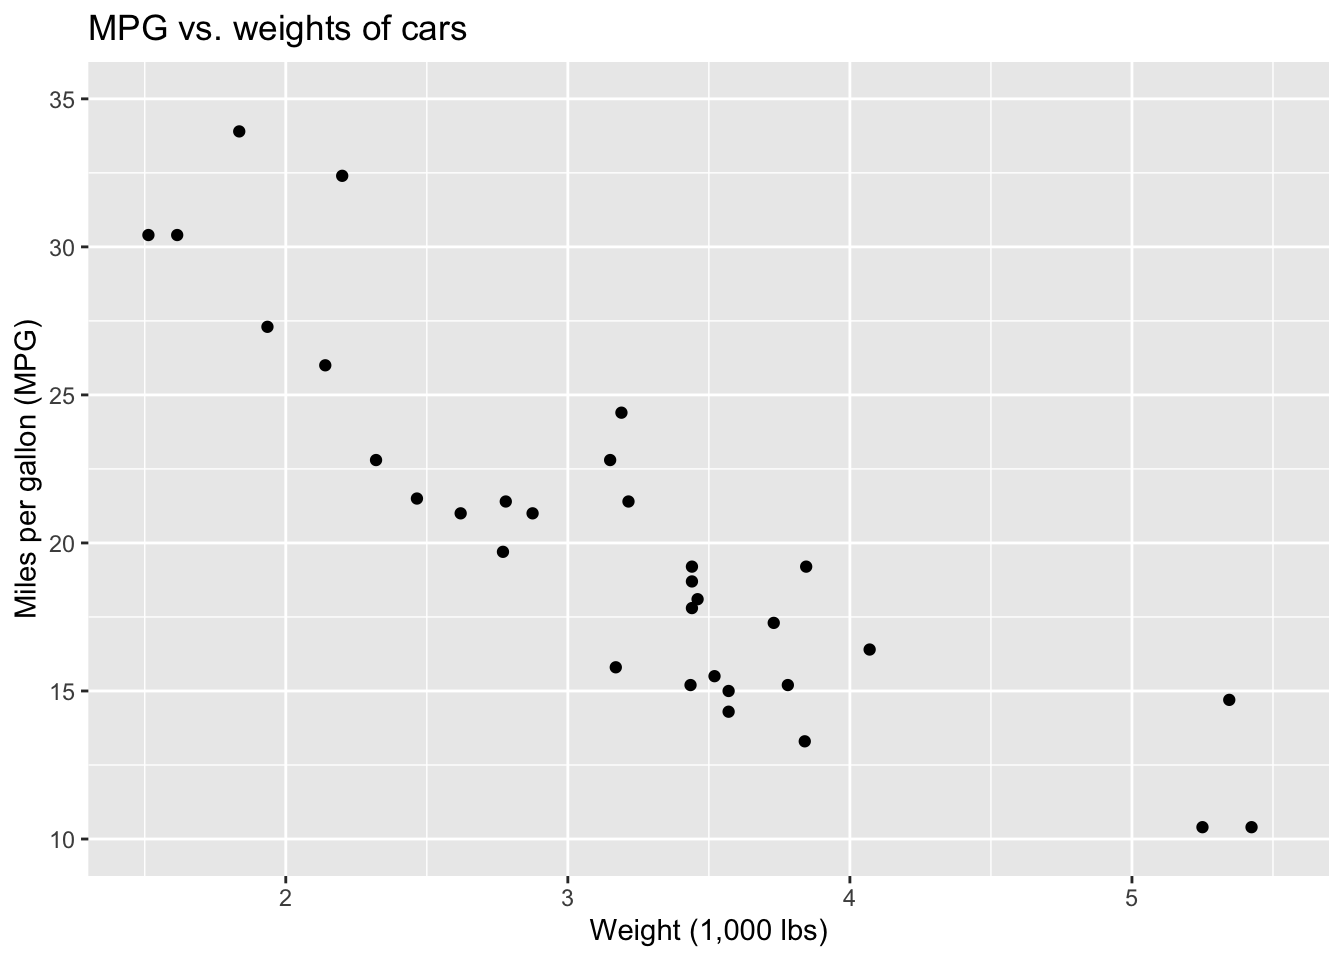
Why didn’t I use \(x=3500\)?
To identify the explanatory variable in a pair of variables, ask yourself which of the two is suspected of affecting the other.
| Explanatory | Response | Field |
|---|---|---|
| \(x\) | \(y\) | statistics, mathematics |
| predictor, covariate | outcome | statistics, data science |
| independent | dependent | social sciences |
| regressor | regressand | econometrics |
| exposure, risk factor | outcome, endpoint | epidemiology, clinical trials |
| treatment | experiments, A/B tests | |
| criterion | psychology | |
| input | output | machine learning, engineering |
| feature | target, label | machine learning |
mpg wt
Mazda RX4 21.0 2.620
Mazda RX4 Wag 21.0 2.875
Datsun 710 22.8 2.320
Hornet 4 Drive 21.4 3.215
Hornet Sportabout 18.7 3.440
Valiant 18.1 3.460
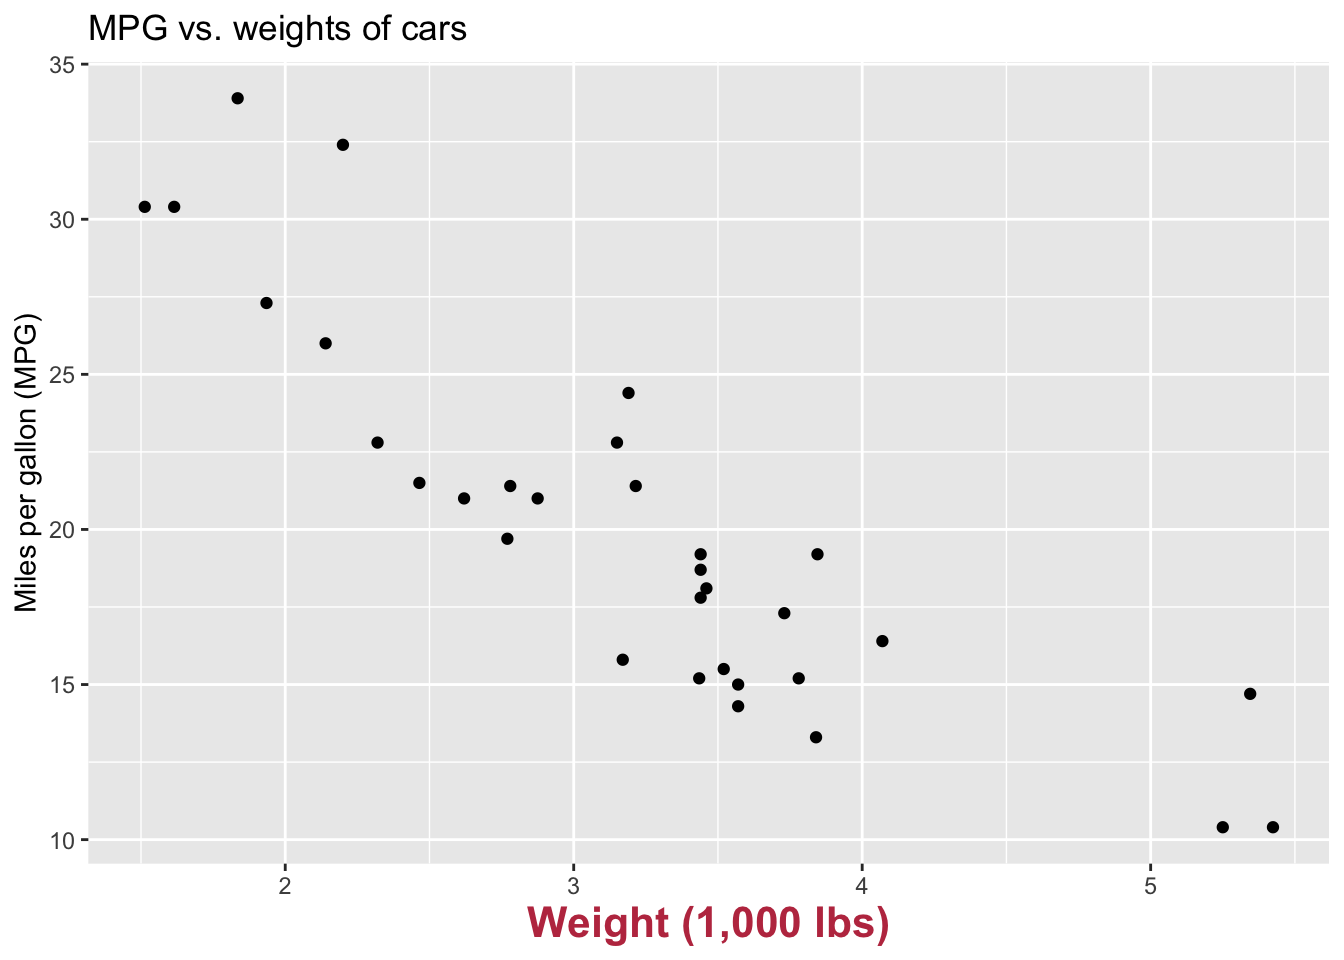
Explanatory goes on the x-axis
mpg wt
Mazda RX4 21.0 2.620
Mazda RX4 Wag 21.0 2.875
Datsun 710 22.8 2.320
Hornet 4 Drive 21.4 3.215
Hornet Sportabout 18.7 3.440
Valiant 18.1 3.460
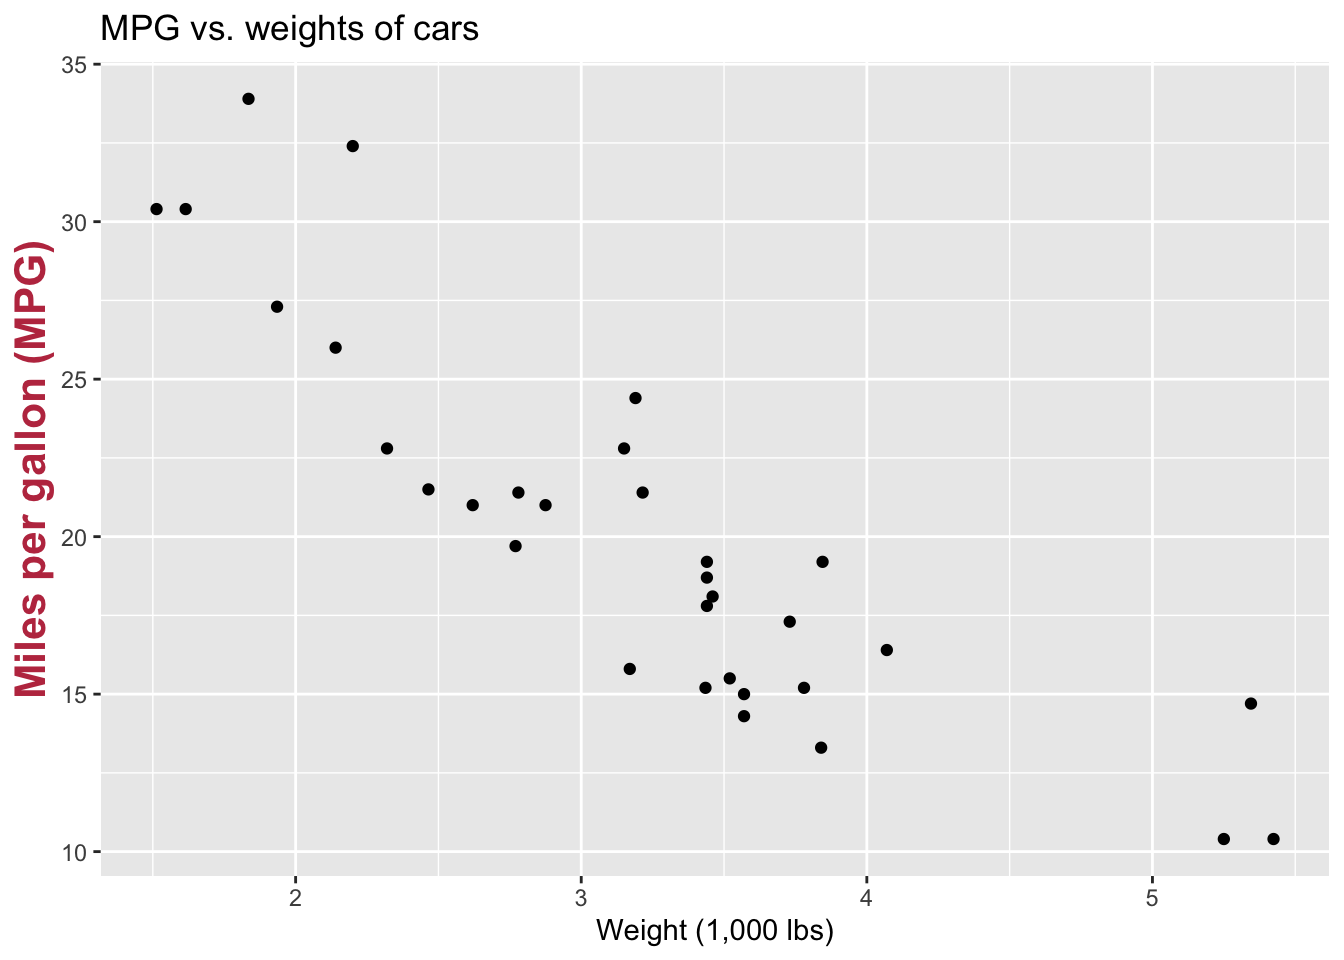
Response goes on the y-axis
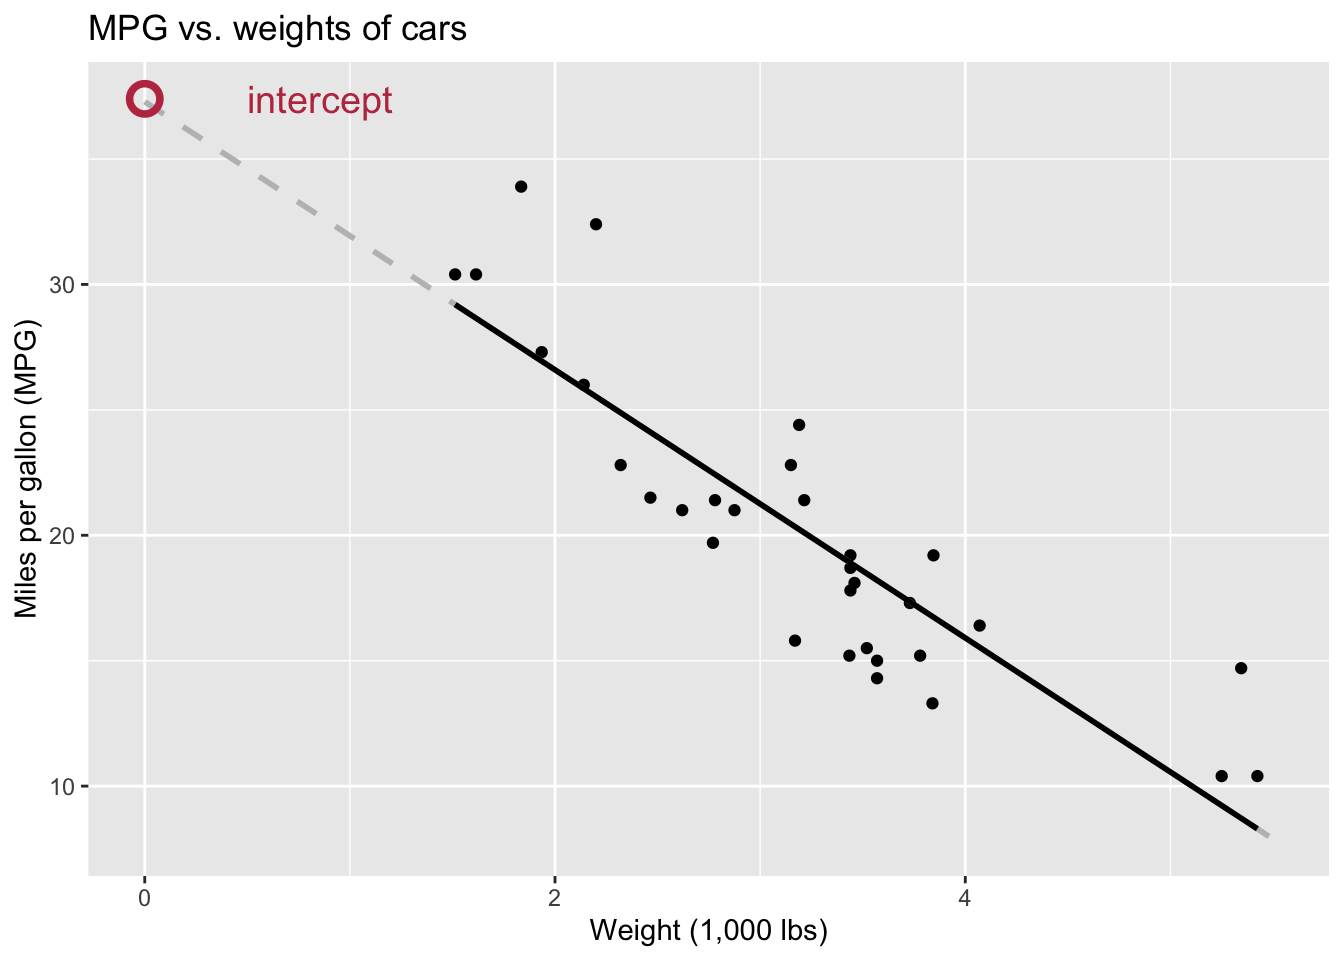
A linear model of the form \(y=mx+b\) can be used to describe the pattern of data.
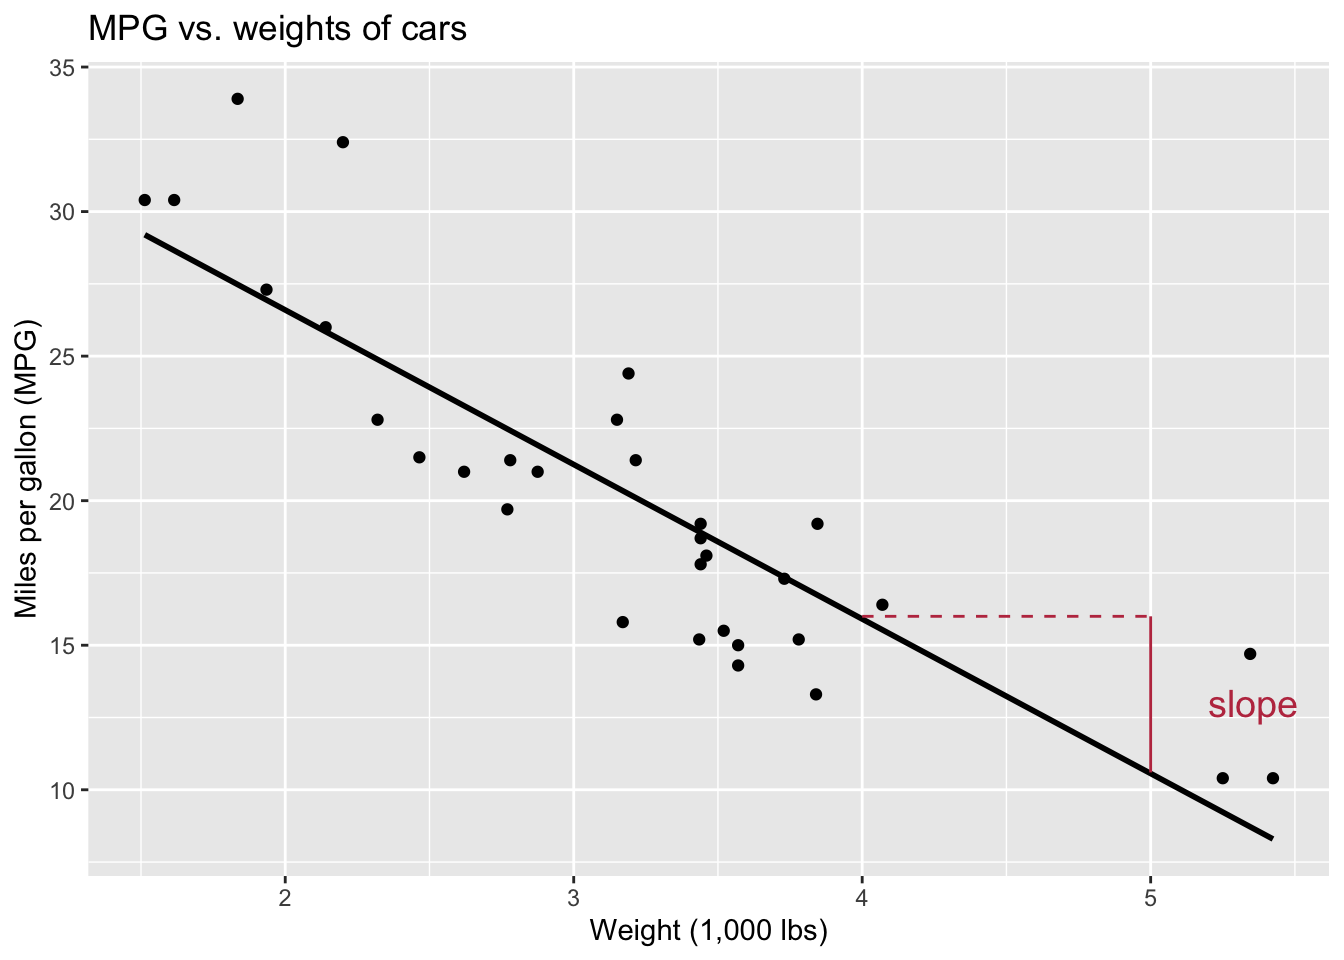
How much does \(y\) change when we increase \(x\) by 1 unit? (rise/run)
If \(x=0\), what is the value of \(y\)? Often meaningless in context of the problem.
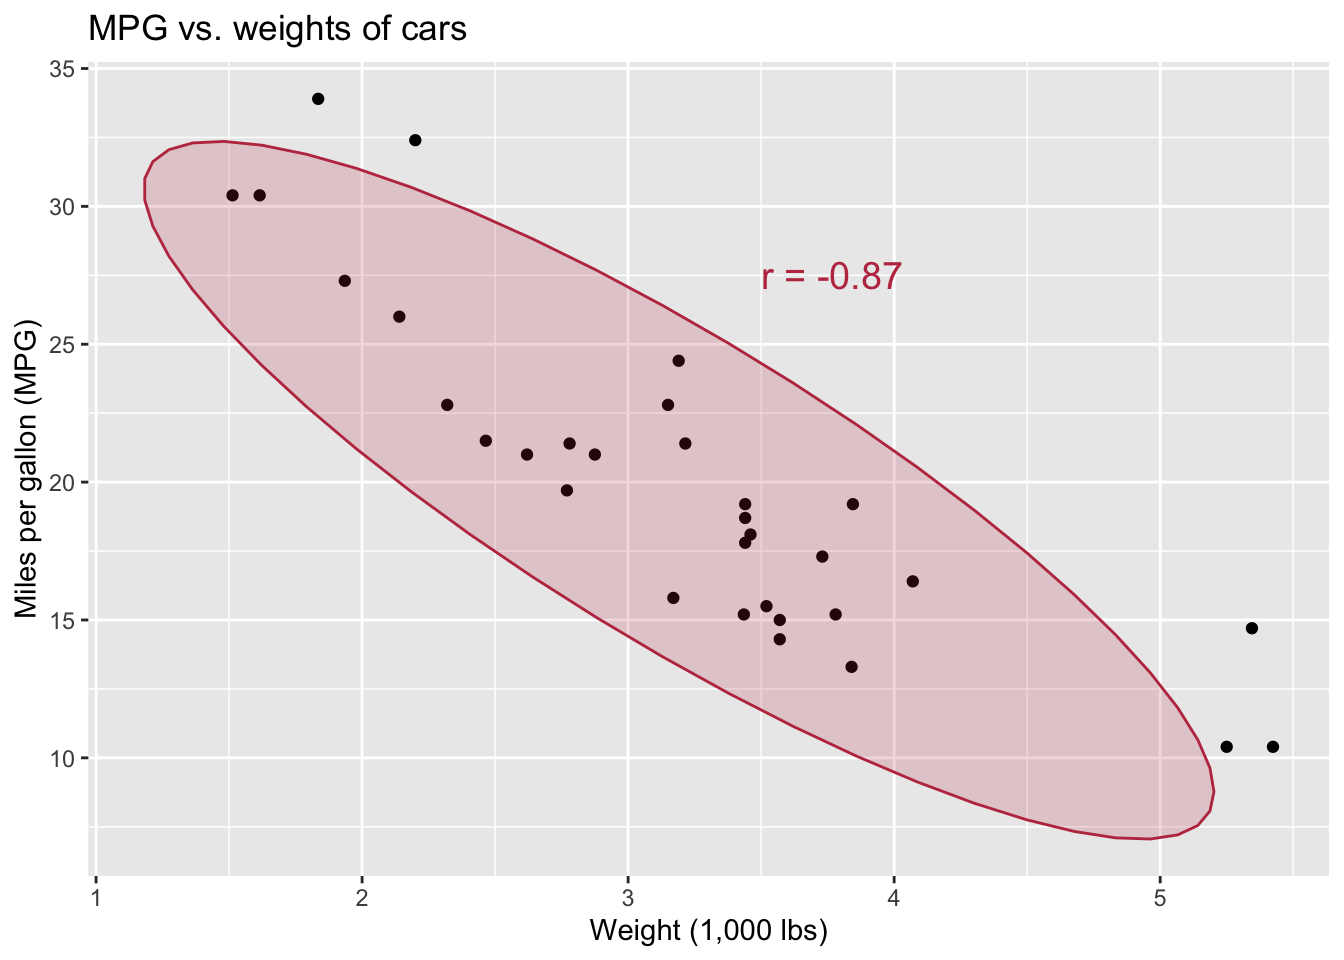
How tightly the points group around that line. How do X and Y covary together.

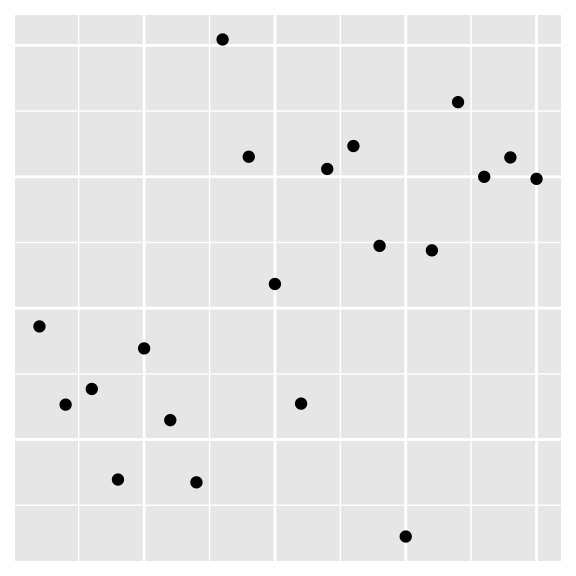
Which of these is the best guess for the correlation between the two variables?
We’ve seen this type of plot before, now let’s get into the math behind how it’s made, and how it’s used for both description and prediction.
A regression model is a function that describes the relationship between the observed data outcome, \(Y\), and the predictor, \(X\).
\[ \begin{aligned} \textbf{DATA} &= \textbf{MODEL} + \text{ERROR} \\[8pt] \mathbf{Y} &= \mathbf{f(X)} + \epsilon \\[8pt] \end{aligned} \]
ERROR is the part of variability in the observed data \(Y\) that is not explained by the model.
\[ \begin{aligned} Y &= \color{#325b74}{\textbf{Model}} + \text{Error} \\[8pt] &= \color{#325b74}{\mathbf{f(X)}} + \epsilon \\[8pt] &= \color{#325b74}{\boldsymbol{\mu_{Y|X}}} + \epsilon \end{aligned} \]
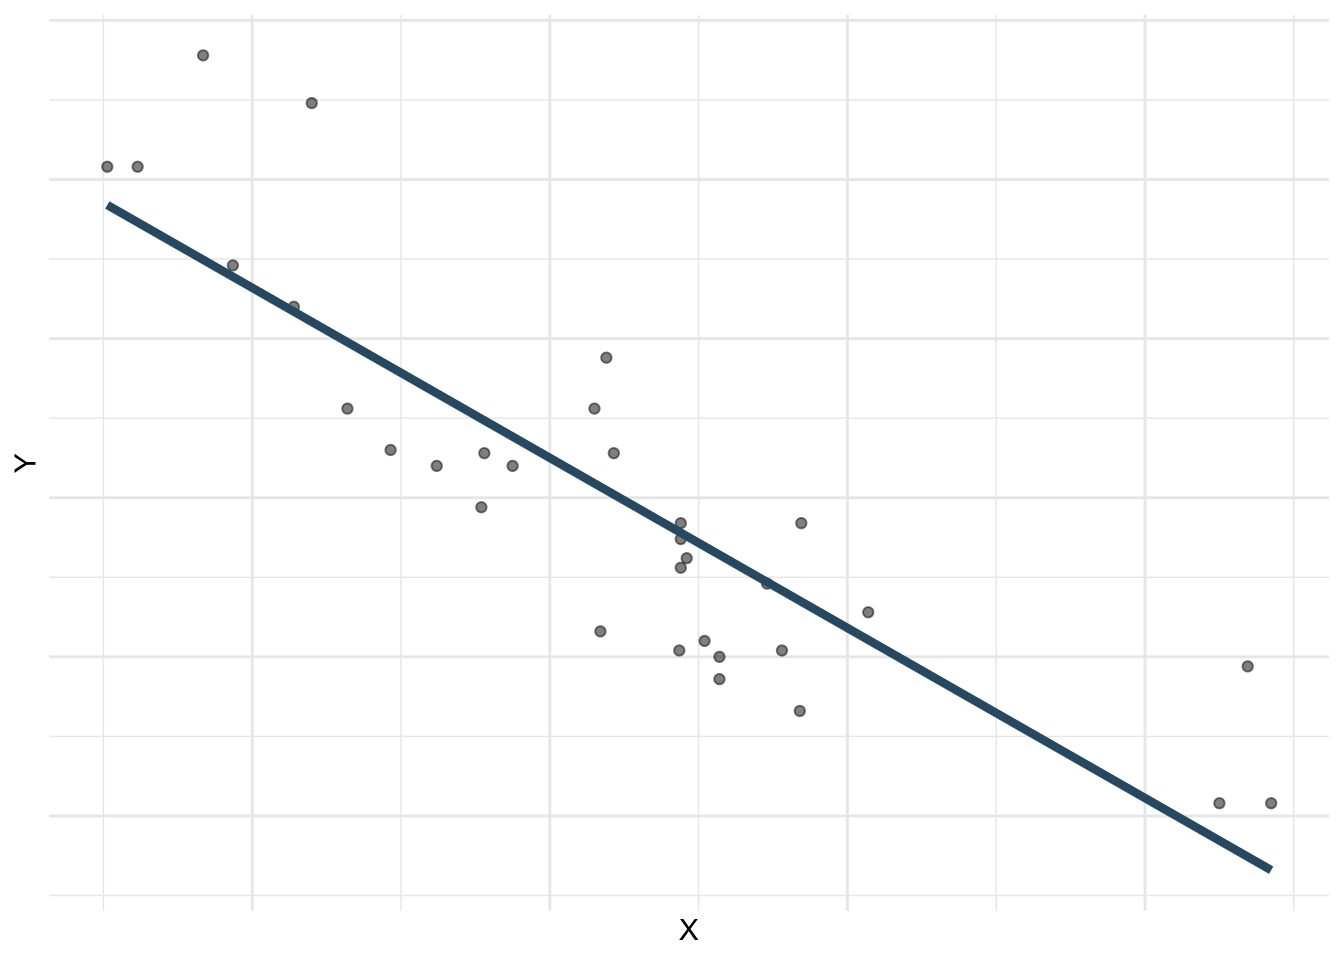
\({\boldsymbol{\mu_{Y|X}}}\) is the population mean of \(Y\), given a particular value for \(X\).
Use simple linear regression to model the relationship between a quantitative outcome (\(Y\)) and a single quantitative predictor (\(X\)): \[\Large{Y = \beta_0 + \beta_1 X + \epsilon}\]
If we knew the true model, we wouldn’t have to estimate it using data. But we don’t, so we do.
\[ \Large{\hat{Y} = b_0 + b_1 X} \]
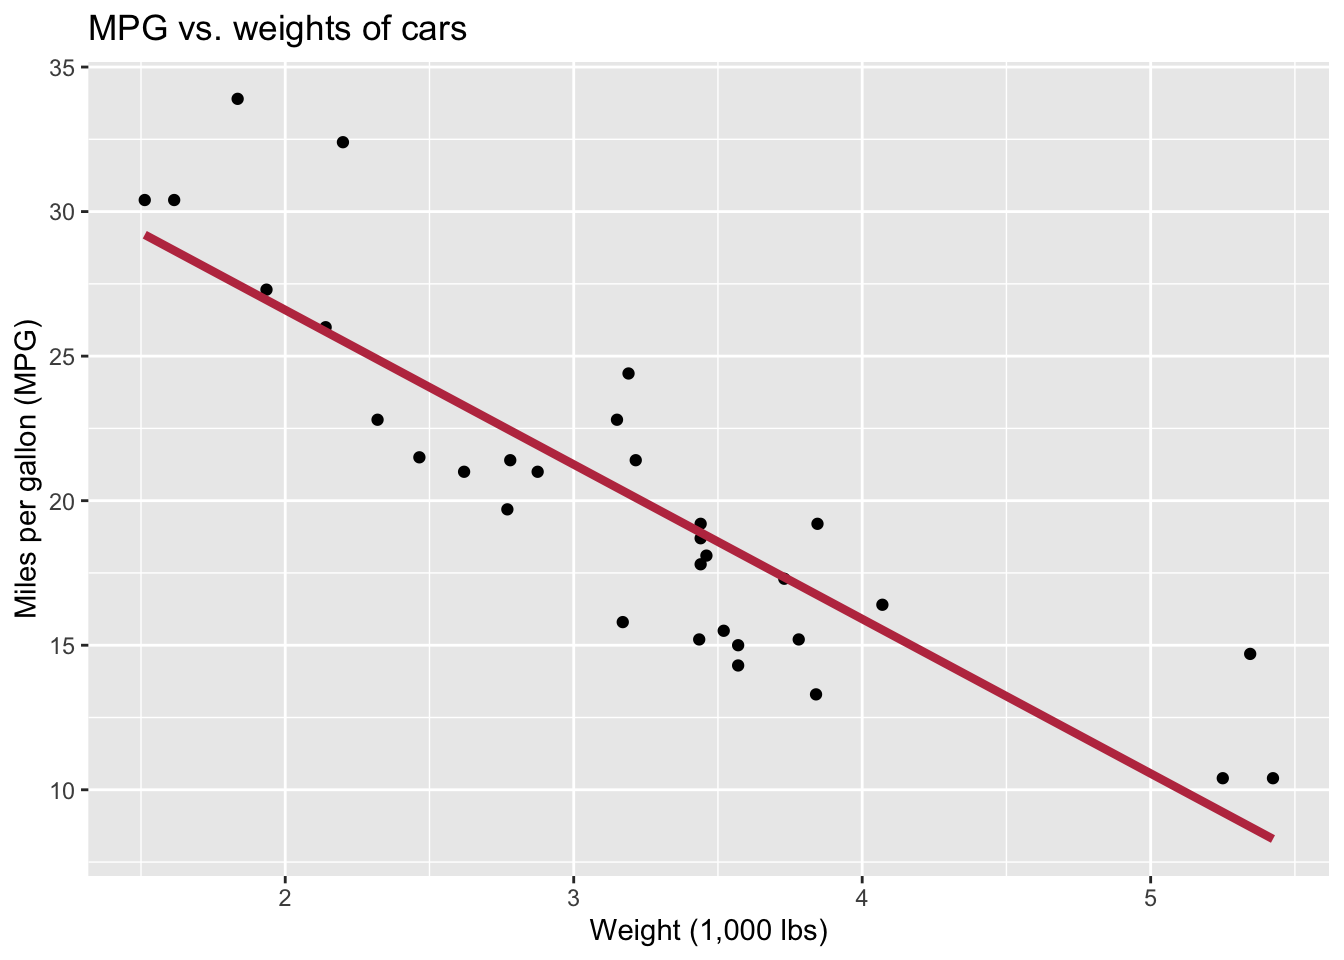
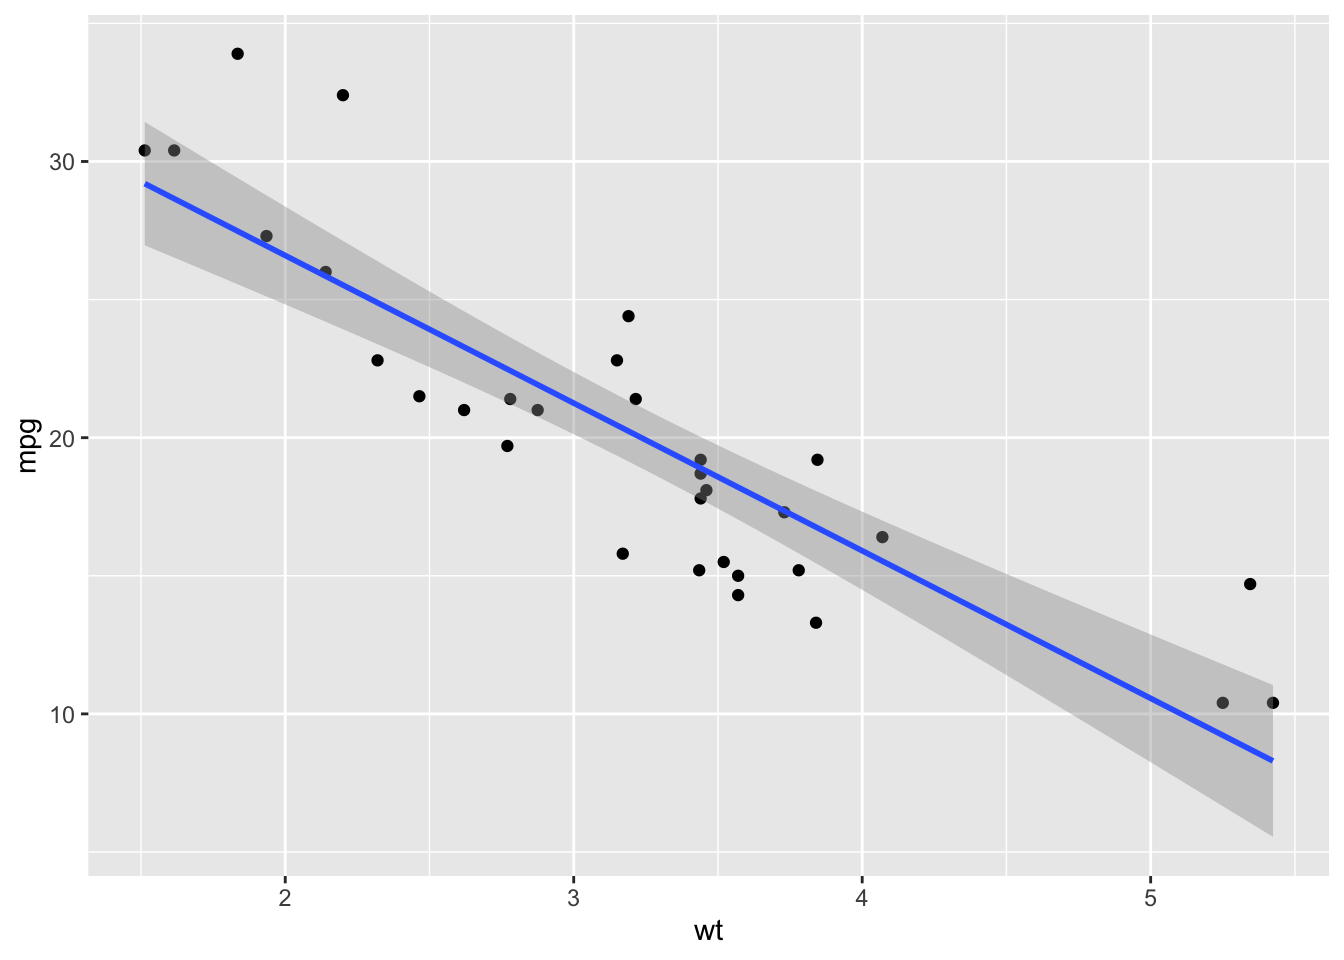
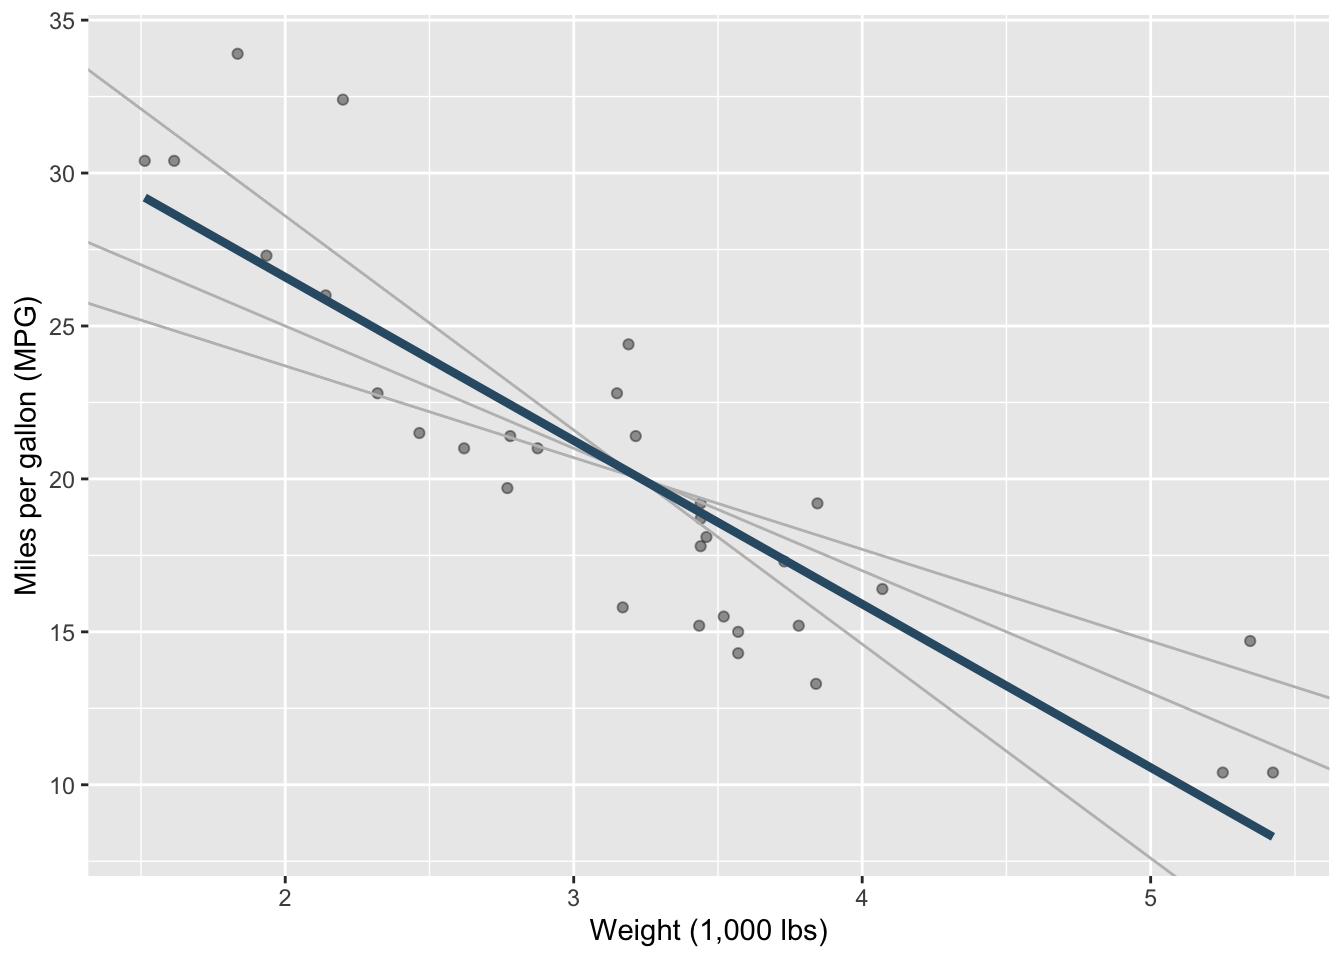
There are infinite number of lines (models) that could be fit. How do we find the model that best explains the data? How do we measure/quantify best?
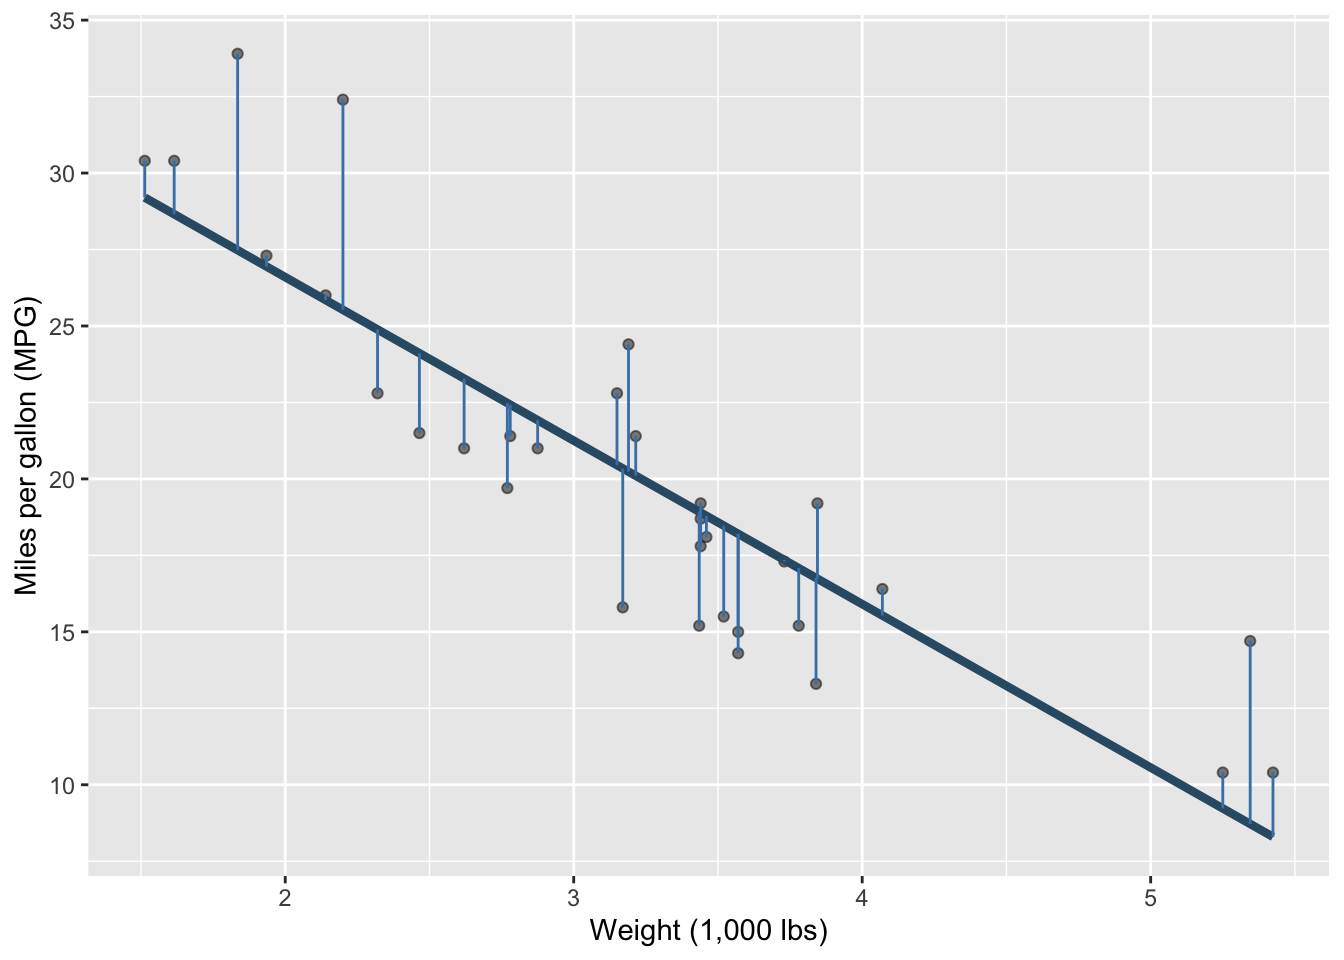
\[ \text{residual} = \text{observed} - \text{predicted} = y - \hat{y} \] How far away from the line (model) are the observed points?
\[ e_i = \text{observed} - \text{predicted} = y_i - \hat{y}_i \]
\[ e^2_1 + e^2_2 + \dots + e^2_n \]
I.e. The OLS is the “best fit” line.
# A tibble: 2 × 5
term estimate std.error statistic p.value
<chr> <dbl> <dbl> <dbl> <dbl>
1 (Intercept) 37.3 1.88 19.9 8.24e-19
2 wt -5.34 0.559 -9.56 1.29e-10
Whatabout lm()? Same concept - linear_reg() is from the tidymodels package and integrates better into a modeling workflow that we’ll use in the next couple sections. Same math.
lm() –> linear_reg() + fit()
summary() –> tidy()
Let \(y\) be MPG and \(x\) be weight (1,000 lbs).
\[\hat{y} = 37.3 - 5.34x\]
The slope is -5.34. Which of the following is the best interpretation of this value?
Let \(y\) be MPG and \(x\) be weight (1,000 lbs).
\[\hat{y} = 37.3 - 5.34x\]
The intercept is 37.3. Which of the following is the best interpretation of this value?
✅ The intercept is meaningful in context of the data if
🛑 Otherwise, it might not be meaningful!
What MPG does the model predict for a car that weighs 3,500 lbs?
\[\hat{y} = 37.3 - 5.34(3.5) \approx 18.6\]
What about a car that weighs 8,000 lbs?
# A tibble: 1 × 1
.pred
<dbl>
1 -5.47
Predicting outside the range of the observed data is extrapolation. The model has no data there, so don’t trust it.
am is coded 0 = automatic, 1 = manual. Make it a categorical variable.
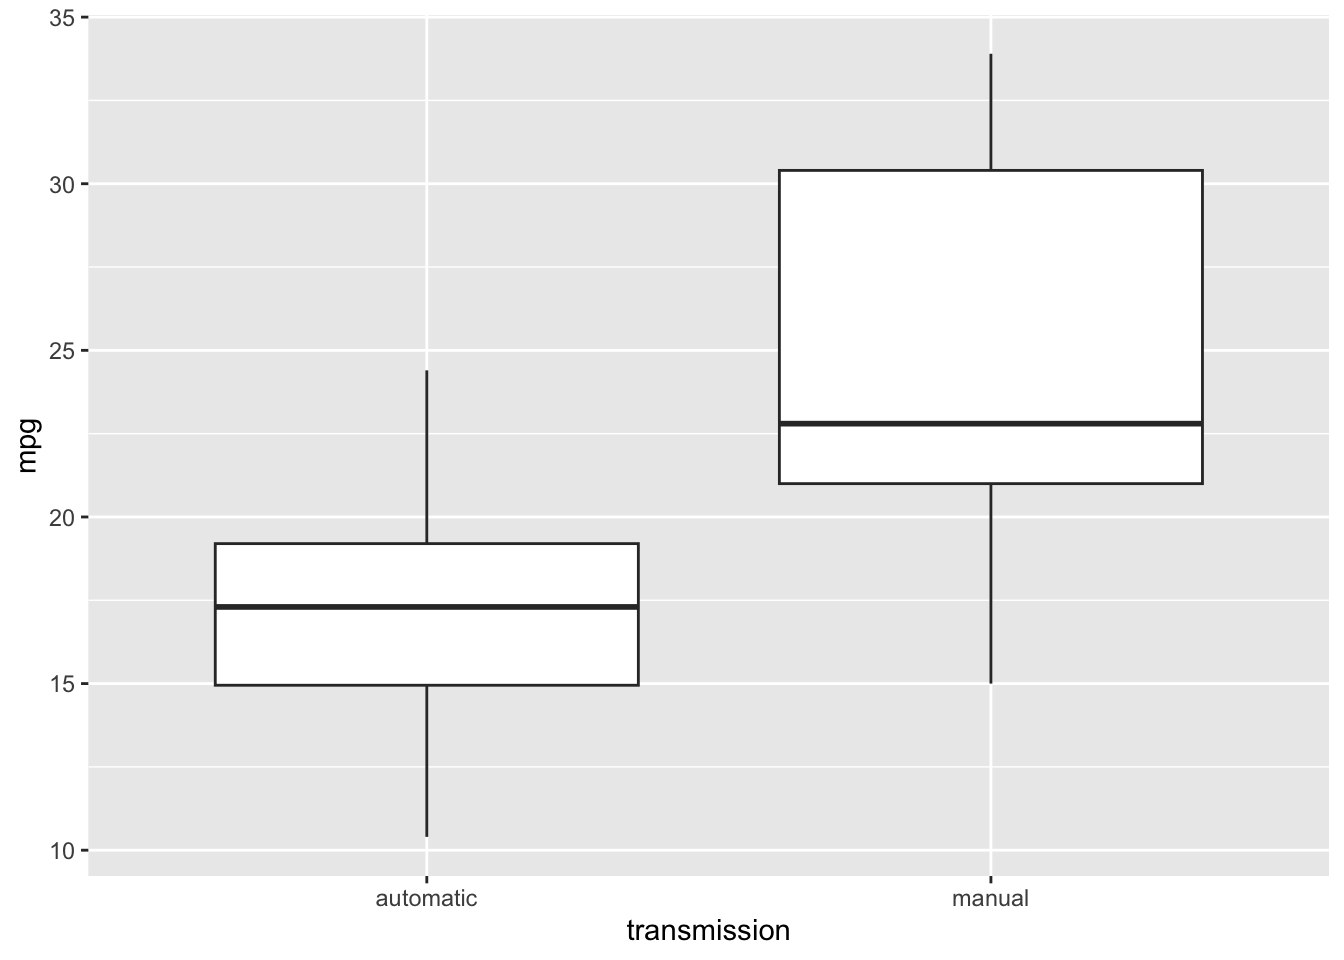
# A tibble: 2 × 2
transmission mean_mpg
<chr> <dbl>
1 automatic 17.1
2 manual 24.4
The mean is a model. We are using \(\bar{y}\) to estimate \(\mu\). But we can build a better model by incorporating information from another variable, \(x\) (transmission).
# A tibble: 2 × 5
term estimate std.error statistic p.value
<chr> <dbl> <dbl> <dbl> <dbl>
1 (Intercept) 17.1 1.12 15.2 1.13e-15
2 transmissionmanual 7.24 1.76 4.11 2.85e- 4
Which transmission is the baseline? How do the intercept and slope relate to the group means on the previous slide?
Let \(y\) be MPG, and let \(x = 1\) for manual cars and \(x = 0\) for automatic cars.
\[\hat{y} = 17.15 + 7.24x\]
transmissionmanual is the indicator variable \(x\) in the equation.Plug in each group:
The intercept is the mean MPG for the baseline group. The slope is the difference between the group means: \(24.39 - 17.15 = 7.24\).
Note
This deck adapts material from STA 199: Introduction to Data Science and Statistical Thinking (Duke University, Fall 2025) by Mine Çetinkaya-Rundel and Mary Knox: Lecture 15, “Language of models,” and Lecture 16, “Linear models with a single predictor.” Source: sta199-f25/sta199-f25.github.io. The videos linked in Setup are from Data Science in a Box (Unit 4, Decks 1 and 2) by Mine Çetinkaya-Rundel, licensed under CC BY-SA 4.0. Modified: combined the two lectures into one deck starting at Lecture 15’s Modeling section; replaced the fandango movie scores data with mtcars; replaced Wooclap polls with discussion questions; dropped the warm-ups, the algorithmic bias section, the blood pressure study, the Tesla example, the gt tables, and the penguins recap; added prediction, extrapolation, and a transmission example for binary predictors.